|
Nyquista Team
Methods of processing
The sound intensity signal recorded by the probe is transformed according to Fourier formulas. This procedure makes it possible to present the signal in the form of a frequency response. In other words, besides obtaining the resulting perceived “loudness” (sound intensity level), we can identify how much acoustic energy is contained in the frequency band of interest from approx. 200 Hz to 20 kHz. As a result of this stage, after recording the signal, for each point above the tested partition we have a time course of the sound intensity level and its frequency characteristic.
Processing the probe’s raw data to enable further interpretation is carried out by an acoustics specialist using specialized software that includes the aforementioned processing methods.
Values and their interpretation
The sound intensity value recorded with the probe (presented in dB) has the advantage that, unlike audible acoustic pressure (also in dB), it provides significantly more acoustic information than we are able to hear. This is primarily about a much greater signal-to-noise ratio in the mid and high frequency ranges, as well as obtaining information on the direction (vector) of sound wave propagation.
And what is the practical meaning of these mentioned advantages? They make it possible to locate the place of sound leakage (i.e., an acoustic bridge) very precisely, even when we cannot hear it due to the low audible acoustic pressure level. This means identifying acoustic bridges in structural terms, and not only because of whether they are audible or not. After applying frequency filtering, we can indicate the specific range that this identified bridge “lets through,” or, based on the known frequency of a potential noise source, determine precisely whether the sounds come exclusively from it, or whether we are dealing with another factor disturbing silence.
On the other hand, during analysis it becomes possible to isolate all other sounds not coming strictly from the tested surface, and even from the side of the point where the probe is currently located. These are “non-switchable” ambient sounds, including background noise and reverberant amplification by the room. This property leads to the ability to determine acoustic power together with establishing the direction of sound emission, in a direct manner. And this is essential for measuring the actual power of production machines and devices, e.g., air-conditioning units, as well as for vector visualization of the acoustic field generated by loudspeakers. Of course, along with detailing into spectral components of sound.
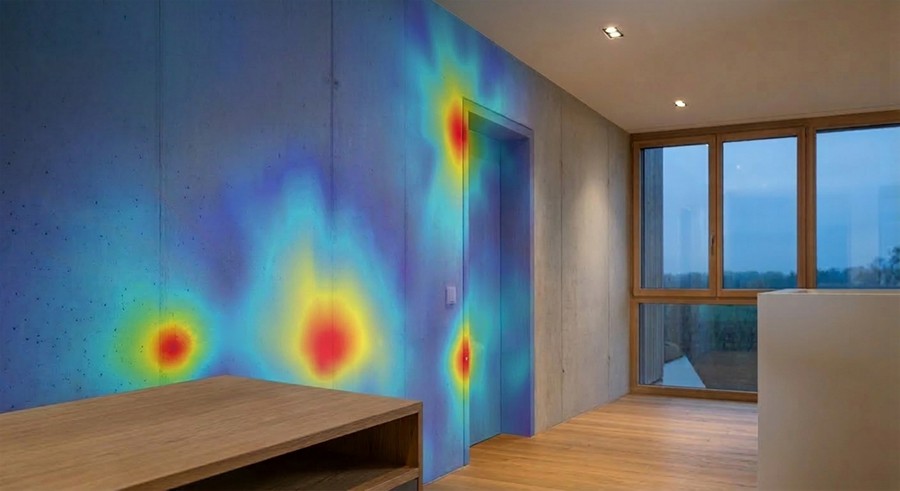
Conclusions and measures
Based on these noise distribution maps prepared using specialized software, we can infer whether the problem of poor insulation of, for example, a door will be solved by replacing it, replacing the seal, the threshold, or whether it is enough to simply adjust or level that door in a specific place. The same also applies to windows and glass partitions.
The obtained noise map of an internal partition wall will indicate the location of wall thinning, made for example by a neighbor who cut channels for hydraulic pipes directly in the wall. It will also make it possible to identify gaps in the wall or at its joints, e.g., with the ceiling.
Based on the assessment of a partition’s permeability and comparison with other partitions within the room, we can determine which one carries the most noise, and increase acoustic insulation precisely in the weakest of them.

See also


Office / Showroom
Production / Warehouse
Let's do something together
Use the form - we will respond as soon as possible!